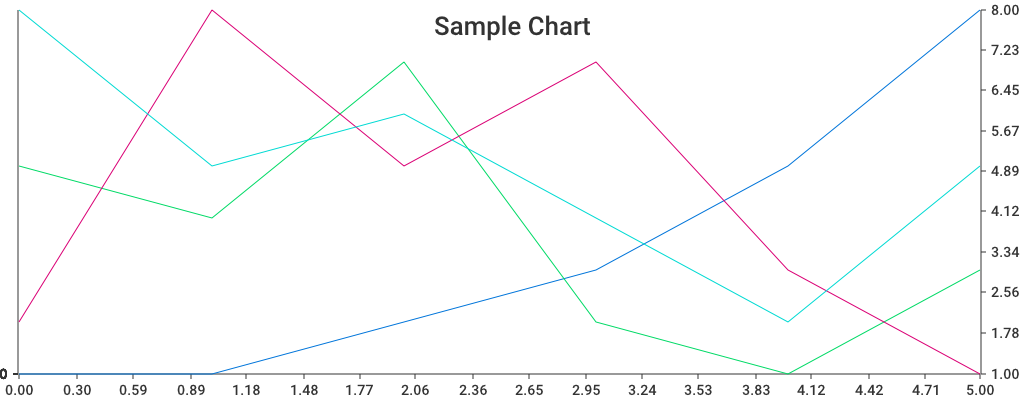
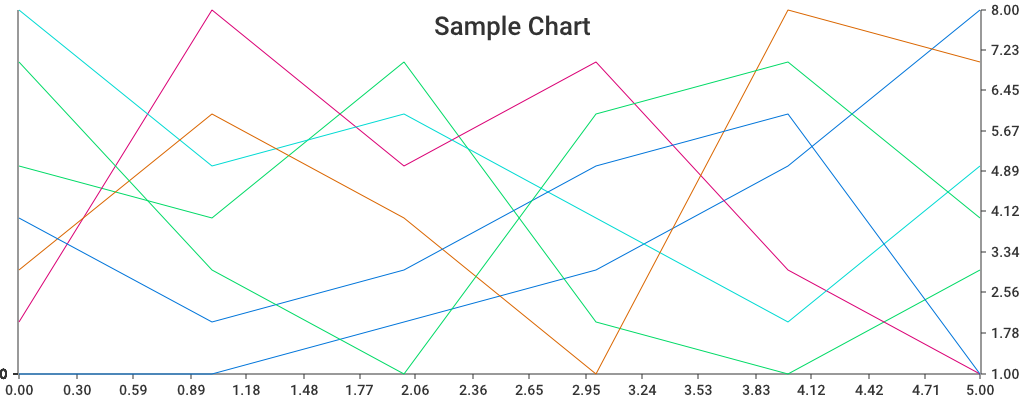
저번 시간에는 go-chart 그래프를 여러 개 출력하는 방법에 대해 포스팅했다.
이번에는 go-chart로 그래프를 여러 개 출력했을 때 기본으로 나오는 그래프 색상이 어떤 식으로 나오는지 살펴볼 것이다!
저번 포스팅을 한번 보고 오는 걸 추천한다!
https://java-coding.tistory.com/66
go-chart 그래프 여러 개 출력하기
저번 포스팅에서 go-chart를 github에서 import 해서 그래프를 출력하는 방법에 대해 작성했었다. 이번에는 그래프를 여러 개 출력하는 방법을 알아보자~! 이 글을 처음 보시는 분들은 저번 포스팅을
java-coding.tistory.com
그래프 1개

- 색상 : 파란색
전체 코드 (main.go)
package main

import (
	"github.com/wcharczuk/go-chart/v2"
	"log"
	"os"
)

var (
	filename    = "output.png"
	numElements = 20
)

func main() {
	x1Values := []float64{0.0, 1.0, 2.0, 3.0, 4.0, 5.0}
	y1Values := []float64{1.0, 1.0, 2.0, 3.0, 5.0, 8.0}

	graph := chart.Chart{
		Title: "Sample Chart",
		Series: []chart.Series{
			chart.ContinuousSeries{
				XValues: x1Values,
				YValues: y1Values,
			},
		},
	}

	f, err := os.Create(filename)
	if err != nil {
		log.Printf("Failed to create file: %v: %v", filename, err)
		return
	}

	defer f.Close()

	err = graph.Render(chart.PNG, f)
	if err != nil {
		log.Printf("Unable to render graph: %v", err)
		return
	}
}
그래프 2개

- 색상 : 연두색
전체 코드 (main.go)
package main

import (
	"github.com/wcharczuk/go-chart/v2"
	"log"
	"os"
)

var (
	filename    = "output.png"
	numElements = 20
)

func main() {
	x1Values := []float64{0.0, 1.0, 2.0, 3.0, 4.0, 5.0}
	y1Values := []float64{1.0, 1.0, 2.0, 3.0, 5.0, 8.0}

	x2Values := []float64{0.0, 1.0, 2.0, 3.0, 4.0, 5.0}
	y2Values := []float64{5.0, 4.0, 7.0, 2.0, 1.0, 3.0}

	graph := chart.Chart{
		Title: "Sample Chart",
		Series: []chart.Series{
			chart.ContinuousSeries{
				XValues: x1Values,
				YValues: y1Values,
			},
			chart.ContinuousSeries{
				XValues: x2Values,
				YValues: y2Values,
			},
		},
	}

	f, err := os.Create(filename)
	if err != nil {
		log.Printf("Failed to create file: %v: %v", filename, err)
		return
	}

	defer f.Close()

	err = graph.Render(chart.PNG, f)
	if err != nil {
		log.Printf("Unable to render graph: %v", err)
		return
	}
}
그래프 3개

- 색상 : 분홍색
전체 코드 (main.go)
package main

import (
	"github.com/wcharczuk/go-chart/v2"
	"log"
	"os"
)

var (
	filename    = "output.png"
	numElements = 20
)

func main() {
	x1Values := []float64{0.0, 1.0, 2.0, 3.0, 4.0, 5.0}
	y1Values := []float64{1.0, 1.0, 2.0, 3.0, 5.0, 8.0}

	x2Values := []float64{0.0, 1.0, 2.0, 3.0, 4.0, 5.0}
	y2Values := []float64{5.0, 4.0, 7.0, 2.0, 1.0, 3.0}

	x3Values := []float64{0.0, 1.0, 2.0, 3.0, 4.0, 5.0}
	y3Values := []float64{2.0, 8.0, 5.0, 7.0, 3.0, 1.0}

	graph := chart.Chart{
		Title: "Sample Chart",
		Series: []chart.Series{
			chart.ContinuousSeries{
				XValues: x1Values,
				YValues: y1Values,
			},
			chart.ContinuousSeries{
				XValues: x2Values,
				YValues: y2Values,
			},
			chart.ContinuousSeries{
				XValues: x3Values,
				YValues: y3Values,
			},
		},
	}

	f, err := os.Create(filename)
	if err != nil {
		log.Printf("Failed to create file: %v: %v", filename, err)
		return
	}

	defer f.Close()

	err = graph.Render(chart.PNG, f)
	if err != nil {
		log.Printf("Unable to render graph: %v", err)
		return
	}
}
그래프 4개

- 색상 : 민트색
전체 코드 (main.go)
package main

import (
	"github.com/wcharczuk/go-chart/v2"
	"log"
	"os"
)

var (
	filename    = "output.png"
	numElements = 20
)

func main() {
	x1Values := []float64{0.0, 1.0, 2.0, 3.0, 4.0, 5.0}
	y1Values := []float64{1.0, 1.0, 2.0, 3.0, 5.0, 8.0}

	x2Values := []float64{0.0, 1.0, 2.0, 3.0, 4.0, 5.0}
	y2Values := []float64{5.0, 4.0, 7.0, 2.0, 1.0, 3.0}

	x3Values := []float64{0.0, 1.0, 2.0, 3.0, 4.0, 5.0}
	y3Values := []float64{2.0, 8.0, 5.0, 7.0, 3.0, 1.0}

	x4Values := []float64{0.0, 1.0, 2.0, 3.0, 4.0, 5.0}
	y4Values := []float64{8.0, 5.0, 6.0, 4.0, 2.0, 5.0}

	graph := chart.Chart{
		Title: "Sample Chart",
		Series: []chart.Series{
			chart.ContinuousSeries{
				XValues: x1Values,
				YValues: y1Values,
			},
			chart.ContinuousSeries{
				XValues: x2Values,
				YValues: y2Values,
			},
			chart.ContinuousSeries{
				XValues: x3Values,
				YValues: y3Values,
			},
			chart.ContinuousSeries{
				XValues: x4Values,
				YValues: y4Values,
			},
		},
	}

	f, err := os.Create(filename)
	if err != nil {
		log.Printf("Failed to create file: %v: %v", filename, err)
		return
	}

	defer f.Close()

	err = graph.Render(chart.PNG, f)
	if err != nil {
		log.Printf("Unable to render graph: %v", err)
		return
	}
}
그래프 5개

- 색상 : 주황색
전체 코드 (main.go)
package main

import (
	"github.com/wcharczuk/go-chart/v2"
	"log"
	"os"
)

var (
	filename    = "output.png"
	numElements = 20
)

func main() {
	x1Values := []float64{0.0, 1.0, 2.0, 3.0, 4.0, 5.0}
	y1Values := []float64{1.0, 1.0, 2.0, 3.0, 5.0, 8.0}

	x2Values := []float64{0.0, 1.0, 2.0, 3.0, 4.0, 5.0}
	y2Values := []float64{5.0, 4.0, 7.0, 2.0, 1.0, 3.0}

	x3Values := []float64{0.0, 1.0, 2.0, 3.0, 4.0, 5.0}
	y3Values := []float64{2.0, 8.0, 5.0, 7.0, 3.0, 1.0}

	x4Values := []float64{0.0, 1.0, 2.0, 3.0, 4.0, 5.0}
	y4Values := []float64{8.0, 5.0, 6.0, 4.0, 2.0, 5.0}

	x5Values := []float64{0.0, 1.0, 2.0, 3.0, 4.0, 5.0}
	y5Values := []float64{3.0, 6.0, 4.0, 1.0, 8.0, 7.0}

	graph := chart.Chart{
		Title: "Sample Chart",
		Series: []chart.Series{
			chart.ContinuousSeries{
				XValues: x1Values,
				YValues: y1Values,
			},
			chart.ContinuousSeries{
				XValues: x2Values,
				YValues: y2Values,
			},
			chart.ContinuousSeries{
				XValues: x3Values,
				YValues: y3Values,
			},
			chart.ContinuousSeries{
				XValues: x4Values,
				YValues: y4Values,
			},
			chart.ContinuousSeries{
				XValues: x5Values,
				YValues: y5Values,
			},
		},
	}

	f, err := os.Create(filename)
	if err != nil {
		log.Printf("Failed to create file: %v: %v", filename, err)
		return
	}

	defer f.Close()

	err = graph.Render(chart.PNG, f)
	if err != nil {
		log.Printf("Unable to render graph: %v", err)
		return
	}
}
그래프 6개

- 색상 : 파란색 (다시 처음 색으로 돌아옴 -> 그래프 1개일 때 색)
전체 코드 (main.go)
package main

import (
	"github.com/wcharczuk/go-chart/v2"
	"log"
	"os"
)

var (
	filename    = "output.png"
	numElements = 20
)

func main() {
	x1Values := []float64{0.0, 1.0, 2.0, 3.0, 4.0, 5.0}
	y1Values := []float64{1.0, 1.0, 2.0, 3.0, 5.0, 8.0}

	x2Values := []float64{0.0, 1.0, 2.0, 3.0, 4.0, 5.0}
	y2Values := []float64{5.0, 4.0, 7.0, 2.0, 1.0, 3.0}

	x3Values := []float64{0.0, 1.0, 2.0, 3.0, 4.0, 5.0}
	y3Values := []float64{2.0, 8.0, 5.0, 7.0, 3.0, 1.0}

	x4Values := []float64{0.0, 1.0, 2.0, 3.0, 4.0, 5.0}
	y4Values := []float64{8.0, 5.0, 6.0, 4.0, 2.0, 5.0}

	x5Values := []float64{0.0, 1.0, 2.0, 3.0, 4.0, 5.0}
	y5Values := []float64{3.0, 6.0, 4.0, 1.0, 8.0, 7.0}

	x6Values := []float64{0.0, 1.0, 2.0, 3.0, 4.0, 5.0}
	y6Values := []float64{4.0, 2.0, 3.0, 5.0, 6.0, 1.0}

	graph := chart.Chart{
		Title: "Sample Chart",
		Series: []chart.Series{
			chart.ContinuousSeries{
				XValues: x1Values,
				YValues: y1Values,
			},
			chart.ContinuousSeries{
				XValues: x2Values,
				YValues: y2Values,
			},
			chart.ContinuousSeries{
				XValues: x3Values,
				YValues: y3Values,
			},
			chart.ContinuousSeries{
				XValues: x4Values,
				YValues: y4Values,
			},
			chart.ContinuousSeries{
				XValues: x5Values,
				YValues: y5Values,
			},
			chart.ContinuousSeries{
				XValues: x6Values,
				YValues: y6Values,
			},
		},
	}

	f, err := os.Create(filename)
	if err != nil {
		log.Printf("Failed to create file: %v: %v", filename, err)
		return
	}

	defer f.Close()

	err = graph.Render(chart.PNG, f)
	if err != nil {
		log.Printf("Unable to render graph: %v", err)
		return
	}
}
그래프 7개

- 색상 : 연두색 (다시 처음 색으로 돌아옴 -> 그래프 2개일 때 색)
전체 코드 (main.go)
package main

import (
	"github.com/wcharczuk/go-chart/v2"
	"log"
	"os"
)

var (
	filename    = "output.png"
	numElements = 20
)

func main() {
	x1Values := []float64{0.0, 1.0, 2.0, 3.0, 4.0, 5.0}
	y1Values := []float64{1.0, 1.0, 2.0, 3.0, 5.0, 8.0}

	x2Values := []float64{0.0, 1.0, 2.0, 3.0, 4.0, 5.0}
	y2Values := []float64{5.0, 4.0, 7.0, 2.0, 1.0, 3.0}

	x3Values := []float64{0.0, 1.0, 2.0, 3.0, 4.0, 5.0}
	y3Values := []float64{2.0, 8.0, 5.0, 7.0, 3.0, 1.0}

	x4Values := []float64{0.0, 1.0, 2.0, 3.0, 4.0, 5.0}
	y4Values := []float64{8.0, 5.0, 6.0, 4.0, 2.0, 5.0}

	x5Values := []float64{0.0, 1.0, 2.0, 3.0, 4.0, 5.0}
	y5Values := []float64{3.0, 6.0, 4.0, 1.0, 8.0, 7.0}

	x6Values := []float64{0.0, 1.0, 2.0, 3.0, 4.0, 5.0}
	y6Values := []float64{4.0, 2.0, 3.0, 5.0, 6.0, 1.0}

	x7Values := []float64{0.0, 1.0, 2.0, 3.0, 4.0, 5.0}
	y7Values := []float64{7.0, 3.0, 1.0, 6.0, 6.0, 1.0}

	graph := chart.Chart{
		Title: "Sample Chart",
		Series: []chart.Series{
			chart.ContinuousSeries{
				XValues: x1Values,
				YValues: y1Values,
			},
			chart.ContinuousSeries{
				XValues: x2Values,
				YValues: y2Values,
			},
			chart.ContinuousSeries{
				XValues: x3Values,
				YValues: y3Values,
			},
			chart.ContinuousSeries{
				XValues: x4Values,
				YValues: y4Values,
			},
			chart.ContinuousSeries{
				XValues: x5Values,
				YValues: y5Values,
			},
			chart.ContinuousSeries{
				XValues: x6Values,
				YValues: y6Values,
			},
			chart.ContinuousSeries{
				XValues: x7Values,
				YValues: y7Values,
			},
		},
	}

	f, err := os.Create(filename)
	if err != nil {
		log.Printf("Failed to create file: %v: %v", filename, err)
		return
	}

	defer f.Close()

	err = graph.Render(chart.PNG, f)
	if err != nil {
		log.Printf("Unable to render graph: %v", err)
		return
	}
}
📝 총 정리
- 그래프 색 총 5개
- 그래프 1개 : 파란색
- 그래프 2개 : 연두색
- 그래프 3개 : 분홍색
- 그래프 4개 : 민트색
- 그래프 5개 : 주황색
- 6개부터는 다시 파란색 -> 연두색 -> 분홍색 -> 민트색 -> 주황색 ... 으로 돌아간다.
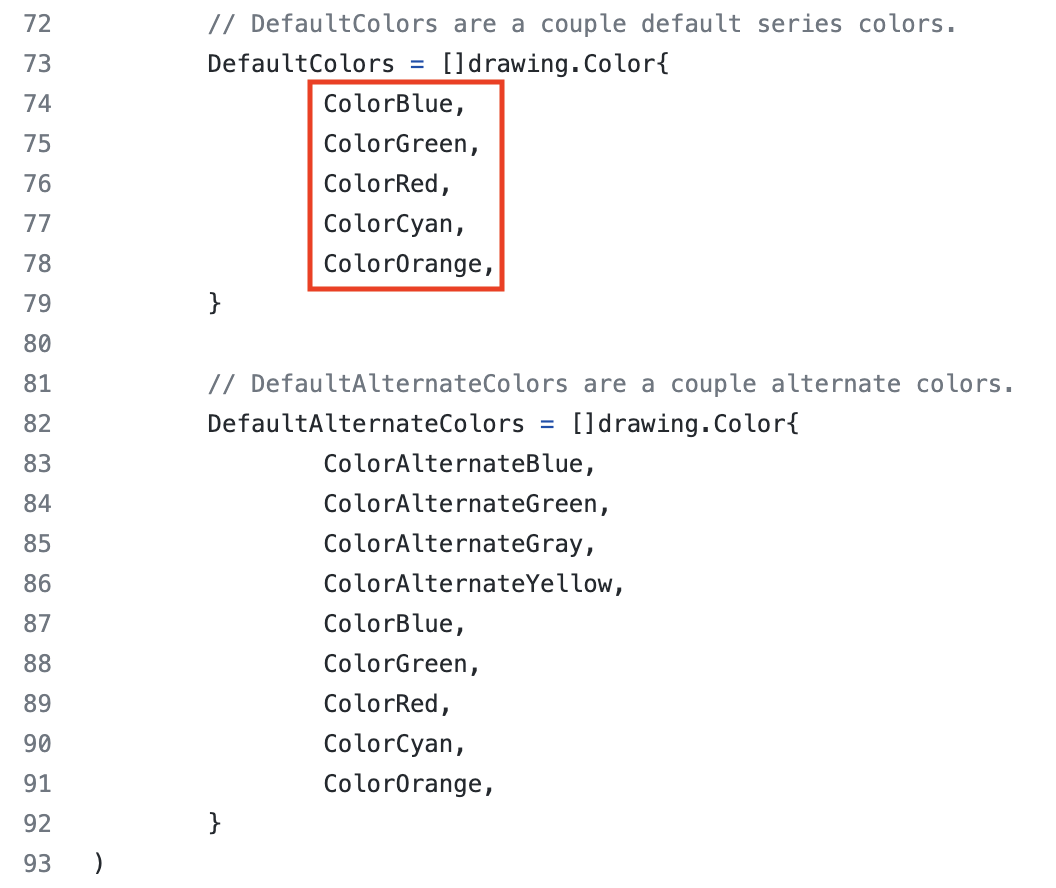
아마 이 설정 때문에 기본으로 색상이 저렇게 나오는 것 같다.
https://github.com/wcharczuk/go-chart/blob/master/colors.go
GitHub - wcharczuk/go-chart: go chart is a basic charting library in go.
go chart is a basic charting library in go. Contribute to wcharczuk/go-chart development by creating an account on GitHub.
github.com

심지어 분홍색이 아니라 빨간색으로 돼있네 ㅋㅋㅋㅋ
그렇다고 한다 ^^
Blue -> Green -> Red -> Cyan -> Orange

혹시 사용자 지정으로 색을 바꿀 수 있는지 찾아봐야겠다!!
'Programming > Go' 카테고리의 다른 글
| go-echarts 사용 전 준비 (0) | 2022.09.28 |
|---|---|
| go-chart 그래프 여러 개 출력하기 (0) | 2022.09.27 |
| go-chart 사용해서 그래프 그리기 (0) | 2022.09.26 |
| Go(Golang) 학습할 때 유용한 사이트 (0) | 2022.08.22 |
| Go(Golang)의 fmt.Errorf() (0) | 2022.08.19 |


댓글